GLOBAL MARKET FOR GAS
In 2018, the global gas market experienced a 4.8% growth in demand, with 70% of that growth coming from the United States and China. The growth in the global gas market can be attributed to increasing in conventional, as well as, relatively unconventional applications, such as Autogas (which experienced 40% increase in consumption in the 10 years). The gas market is connected to the oil market, but they do not necessarily follow the same trends as they have different market drivers; this is why the gas market experienced growth in demand while the oil market grew by 1%, between 2017 and 2018.
Where Does Natural Gas Come From?
A good starting point to understand the gas market will be from its source. Hydrocarbons - crude oil and natural gas, are formed due to the pressurization of decayed organic matter over millions of years. This occurs in a naturally occurring underground reservoir. Each reservoir has a range of hydrocarbon products in it, from natural gas (methane to butane, with the presence pentane to heptane), to crude oil, as well as asphalt. The Gas to Oil Ratio (GOR) determines whether the gas is referred to as Associated Gas (i.e. gas from an oil well) or Non-Associated Gas (i.e. gas from a gas well). The GOR used by the United States Energy Information Agency is 6,000 cubic feet (cf) of gas to 1 barrel (b) of oil (6000 cf/b). Therefore a well whose GOR equal to or less than 6,000 cf/b is an oil well, gas produced from that well is referred to as Associated Gas. The major products from the separation of hydrocarbon gas are Natural Gas (methane and ethane) and Liquefied Petroleum Gas.
Figure 1. Natural Gas and its Products
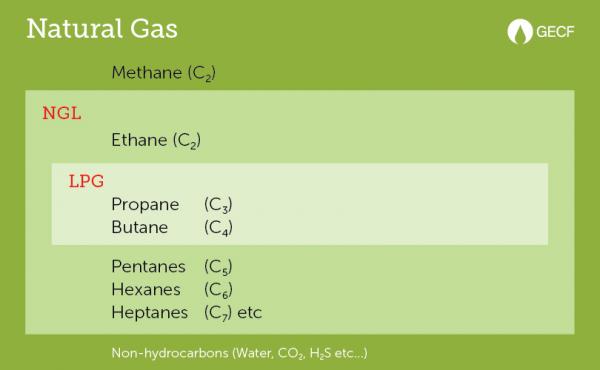
Source: (GECF, 2016)
Gas Value Chain
Natural gas can be divided based on its constituents into different products, such as Natural Gas Liquids, Liquefied Petroleum Gas (LPG), Compressed Natural Gas, etc. These products might differ due to composition or physical state (e.g. liquid or gas).
There are different sectors in the petroleum industry which include:
- Upstream sector: this is where the exploration and production occurs
- Midstream sector: this is where the refining, or processing occurs.
- Downstream sector: this is where the product is connected to the end-user.
Natural gas is produced then separated into different products with different (sometimes overlapping) applications, hence their different value chains.
- Natural Gas (Sales Gas): this is the mixture of methane and ethane, used mostly by industries for different processes such as electricity production, or fertilizer production. It is transported via pipelines (quantity traded is known by measuring the flow rate of the gas at the exchange of ownership). Pipelines are channelled to the end-users which are industrial or commercial entities.
Figure 2. Natural Gas Value Chain
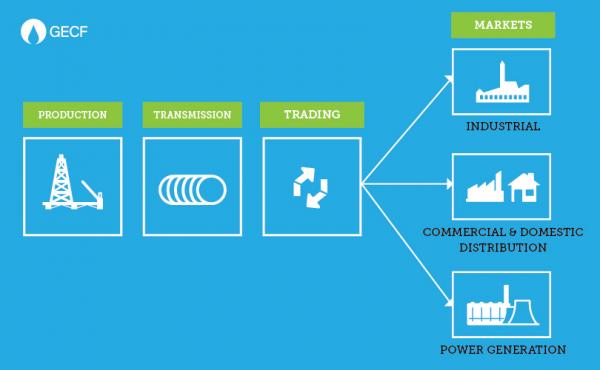
Source: (GECF, 2016)
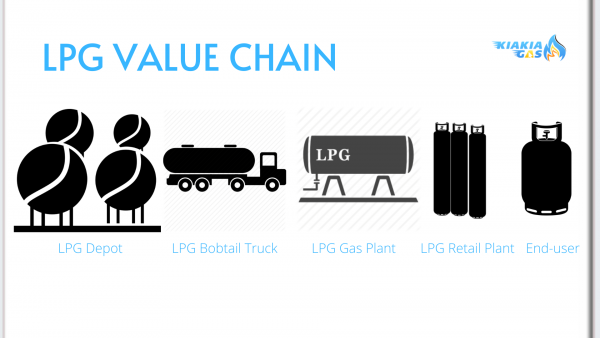
- Liquefied Petroleum Gas: this composes of pentane and butane, used mostly for cooking, and is finding increasing application in the automobile industry as Autogas. LPG is transported via pipelines, ships and trucks, based on the sector (upstream, midstream or downstream). When imported, LPG comes through a depot which is then transported to various gas plants from which it is connected (sometimes through retailers) to the end-users in cylinders.
Figure 3. LPG Value Chain
- Liquefied Natural Gas: natural gas is liquefied, after which it is stored then transported via land or ship (depending on the destination) to the end-users for power generation, transportation, etc. It is re-gasified before use.
Figure 4. LNG Value Chain
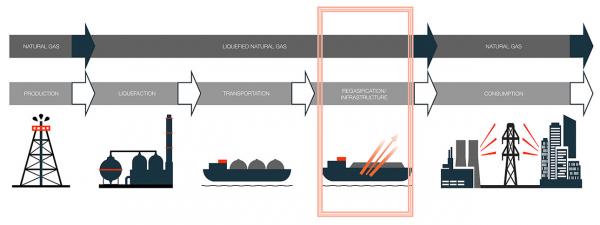
Source: (Hoegh LNG, 2020)
MAJOR PLAYERS IN THE GAS INDUSTRY
Oil and gas, as natural minerals, occur in different regions all over the world and are consumed in nations all over the world as well. The total recoverable (i.e. economically viable recovery) amount of oil and gas is referred to as oil and gas reserves, and they vary per country, with some countries having trillions of cubic meters of natural gas in their reserves and some countries having none. Two other factors measured are the annual production and annual consumption, which vary per country and also change with time due to economic reasons, or technology available, amongst other reasons. For instance, US crude oil production tripled between 2010 and 2020 due to the introduction of the hydraulic fracturing technology which made shale oil recoverable. Lastly, these activities are carried out by private companies and state-owned companies, sometimes in joint-ventures with each other. Certain companies have more presence globally than others (e.g. Shell operates in 70 companies globally) (Shell, 2020).
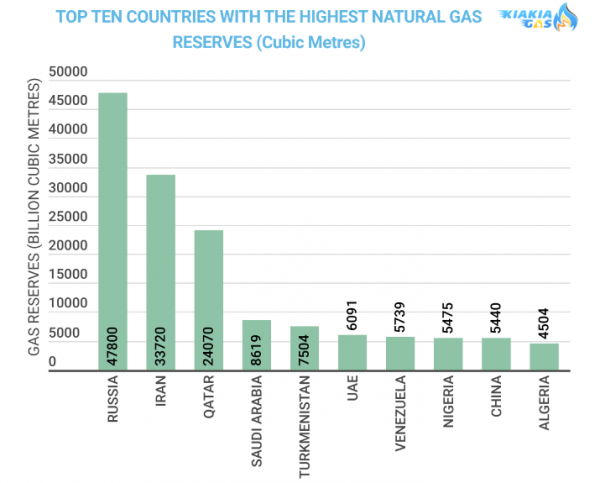
- Natural Gas Reserves: Reserves refer to the total quantity of oil and gas that can be recovered under current economic, technological and political conditions, in a country. Russia has the world’s largest gas reserves, boasting of 47.8 trillion m3 of natural gas. Russia is followed by Iran and Qatar in size of gas reserves, with 33.7 trillion m3 and 24 trillion m3 respectively. What countries do with their reserves depends on their governments. These top ten nations have a combined gas reserve size of 148 trillion m3 of natural gas.
Figure 5. Top Ten Countries with the Highest Natural Gas Reserves
Source: (Central Intelligence Agency, 2020)
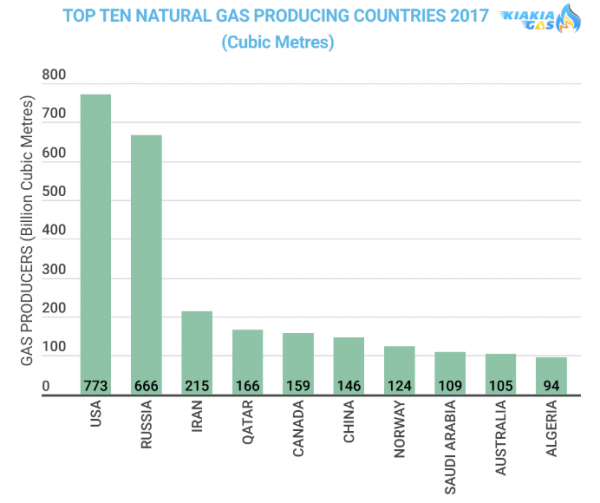
- Natural Gas Production: Natural gas production is based on how much Natural Gas is mined out oil and gas wells annually. Investments are needed to produce gas and can be hindered by political instability. This is why certain countries with large natural gas reserves but do not produce as much natural gas as those with smaller natural gas reserves. The USA produces the most amount of natural gas annually, producing 773 billion m3. The USA is followed by Russia and Iran, which produce 666 billion m3and 215 billion m3 respectively. It should be noted that the three countries with the highest also produce the most natural gas, although the USA produces the most. Total natural gas produced by the top ten producing countries was 2.55 trillion m3.
Figure 6. Top Ten Natural Gas Producing Countries 2017
Source: (Central Intelligence Agency, 2020)
- Natural Gas Consumption: this refers to the amount of natural gas used in a country. After processing, it’s by-products are used for separate applications e.g. LPG is mainly used for cooking, sales gas is used for electricity, e.t.c. The consumption of natural gas depends on the demand for those applications that require natural gas products in those countries.
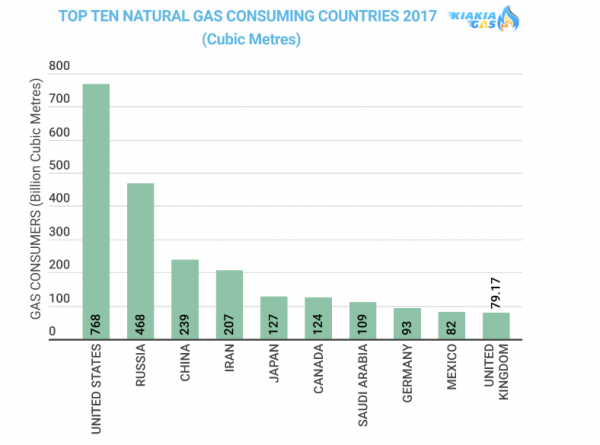
The USA is the top consumer of Natural Gas, consuming 768 billion m3 of the 773 billion m3 it producers; thereby producing more than it consumes. Russia and China are also top consumers, consuming 468 billion m3 and 239 billion m3 respectively. Russia consumes 200 billion m3 less than it produces, while China consumes 93 billion m3 more than it produces. Total natural gas consumed by the top ten consuming countries was 2.29 trillion m3.
Figure 7. Top Ten Natural Gas Consuming Countries 2017
Source: (Central Intelligence Agency, 2020)
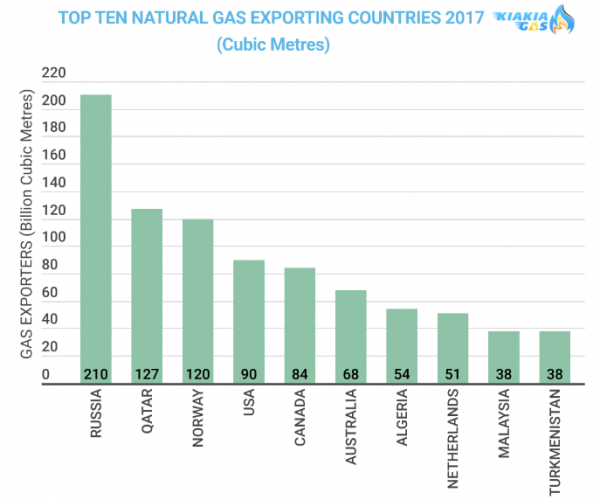
- Natural Gas Exports: exports refer to the amount of natural gas sold out of the country. Countries which export more than they import are referred to as net exporters. The various products can be exported through pipelines, ships, trucks. Russia exports the most natural gas, with Qatar and Norway following; they export 210 billion m3, 127 billion m3, and 120 billion m3 respectively. The top ten exporters export a total of 880 billion m3. Analysing the top ten producers and exporters, only 34% of the natural gas produced is exported.
Figure 8. Top Ten Natural Gas Exporting Countries 2017
Source: (Central Intelligence Agency, 2020)
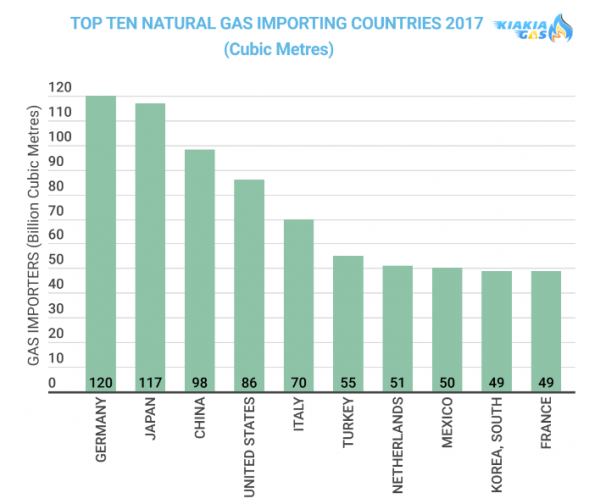
- Natural Gas Imports: this refers to the amount of gas brought into a country from another. A country which imports more than it exports is referred to as a net-importer. Germany imports the most natural gas, with Japan and China following; each has 120 billion m3, 117 m3, and 98 m3 respectively. The total amount of natural gas imported by the top ten importing countries is 743 billion m3.
Figure 9. Top Ten Natural Gas Importing Countries 2017
Source: (Central Intelligence Agency, 2020)
The Nigerian Context
Nigeria has the 8th largest natural gas reserves in the world and has the 18th highest production rate. Nigerian natural gas products are mainly exported because local consumption is less than half of total production. This is caused by mainly economic factors. The Nigerian gas market holds the potential for profitable investment as it has been gradually expanding, with local consumption increasing from 573 million scf/d in 2004 to about 839.70 million scf/d in 2016 (NNPC, 2020).
Table 1. Nigeria’s Gas Parameters 2017

Source: Compiled from Central Intelligence Agency Reports.
As the world sees development in technology and economies, gas production and consumption will increase. Natural gas is also a (relatively) clean fuel source, helping with public perception. The gas market shows potential to expand and accommodate more investors and customers, the future of the gas market is bright.
KiakiaGas Limited is a leading Gas business in Lagos,Nigeria with expertise in LPG retailing, New Gas Market development, Building of Gas Plants and Gas strategy advisory
If you need a partner with hands-on local expertise in the Nigerian Gas space or any of our bespoke solutions/services, write us at gaspreneur@kiakiagas.com or call/Whatsapp: +2348085269328
Bibliography
Auto-Gas.Net, 2017. Why AutoGas. [Online]
Available at: https://auto-gas.net/why-autogas/autogas-is-growing/
[Accessed 23 April 2020].
Central Intelligence Agency, 2020. COUNTRY COMPARISON :: NATURAL GAS - CONSUMPTION. [Online]
Available at: https://www.cia.gov/library/publications/resources/the-world-factbook/fields/270rank.html
[Accessed 23 April 2020].
Central Intelligence Agency, 2020. COUNTRY COMPARISON :: NATURAL GAS - EXPORTS. [Online]
Available at: https://www.cia.gov/library/publications/resources/the-world-factbook/fields/271rank.html
[Accessed 23 April 2020].
Central Intelligence Agency, 2020. COUNTRY COMPARISON :: NATURAL GAS - IMPORTS. [Online]
Available at: cia.gov/library/publications/resources/the-world-factbook/fields/272rank.html
[Accessed 23 April 2020].
Central Intelligence Agency, 2020. COUNTRY COMPARISON :: NATURAL GAS - PRODUCTION. [Online]
Available at: https://www.cia.gov/library/publications/resources/the-world-factbook/fields/269rank.html
[Accessed 23 April 2020].
Central Intelligence Agency, 2020. COUNTRY COMPARISON :: NATURAL GAS - PROVED RESERVES. [Online]
Available at: https://www.cia.gov/library/publications/resources/the-world-factbook/fields/273rank.html
[Accessed 23 April 2020].
Emily Geary, J. P., 2019. Associated gas contributes to growth in U.S. natural gas production. [Online]
Available at: https://www.eia.gov/todayinenergy/detail.php?id=41873
[Accessed 23 April 2020].
GECF, 2016. Gas Value Chain. [Online]
Available at: https://www.gecf.org/gas-data/gas-value-chain.aspx
[Accessed 23 April 2020].
Hoegh LNG, 2020. Our Business. [Online]
Available at: https://www.hoeghlng.com/our-business/default.aspx
[Accessed 24 April 2020].
Maverick, J. B., 2020. How has fracking decreased U.S. dependence on foreign oil?. [Online]
Available at: https://www.investopedia.com/ask/answers/012915/how-has-fracking-helped-us-decrease-dependence-foreign-oil.asp
[Accessed 23 April 2020].
NNPC, 2020. Nigeria Gas. [Online]
Available at: https://www.nnpcgroup.com/Investor-Relations/Pages/Nigeria-Gas.aspx
[Accessed 24 April 2020].
Shell, 2020. About Us. [Online]
Available at: https://www.shell.us/about-us.html
[Accessed 23 April 2020].