The Potential Role of Liquefied Natural Gas (LNG) in Producing Cleaner Energy

Submitted by kiakiagas on

Introduction

Combating climate change involves a drastic change in the patterns of energy production and consumption that does not interfere with the quality of life and economic growth. The Sustainable Development Goals (SDGs) have also been placed on the agenda to include access to affordable, secure and sustainable resources. SDGs emphasize that access to energy must be established by the use of non-conventional emerging energy sources in an economically viable and environmentally sustainable manner. Energy has been a key driver of social and economic growth, helping to alleviate hunger, increase food production and access to clean water, improving public health and education, creating economic opportunities for young people and empowering women. Around the same time, the availability of electricity from conventional fossil fuel sources has raised the amount of pollution in the atmosphere exponentially.


As a way to mitigate the adverse effects of climate change, low-carbon energy policies have been proposed. A better quality of life depends on access to energy from natural gas, and a portion of the world's population do not have access to modern energy services. Across the globe, energy demand and supply are not consistent. Consequently, each region is striving to source for cleaner energy in order to increase the quality of life instead of contributing to global warming with the use of dirty energy. An example of this is the option of natural gas as a fuel to ensure a smooth transition to a sustainable world of energy. The earth has large amounts of natural gas, but most of it is in places far from where the gas is required. Natural gas must be converted into liquefied natural gas (LNG) so as to be able to transport this cleaner-burning fuel through oceans, a process called liquefaction. This has changed with the introduction of floating storage and regasification units (FSRUs), which are basically floating terminals for the LNG. This article attempts to assess the possible roles of LNG in generating cleaner energy for electricity and transport.


Liquefied Natural Gas (LNG)

According to the Britannica (2020) LNG is a natural gas (NG) that has been liquefied for ease of storing and transporting which is 600 times smaller than natural gas when it is in its gaseous form, and it can be easily shipped overseas. LNG is produced by cooling natural gas below its boiling point, −162 °C (−259 °F), and is stored in double-walled cryogenic containers at or slightly above atmospheric pressure. By merely increasing the temperature, it can be transformed back to its gaseous state. Aside from Angola, Equatorial Guinea, and Cameroon, Nigeria is one of the countries blessed with LNG in Sub-Saharan Africa.


Roles of LNG in Providing Cleaner Energy

The role of LNG has been largely positive over the last two decades. LNG has contributed to reducing carbon emissions and provided reliable support and back-up for renewable energy. Two of the biggest decarbonizers on an absolute and relative basis are the United States and the United Kingdom. They have dramatically reduced their coal burnt in the power generation sector while greatly increasing the penetration of natural gas. In the United Kingdom, a modest carbon tax has been adopted to essentially eliminate coal from the country’s power generation mix. The United States has no carbon tax, but the shale gas revolution has lowered the cost of natural gas to a level that leaves many coal-fired power plants unable to compete. In Europe and Korea, despite the occasional policy inconsistency, trends are in a similar direction—the combination of renewables and natural gas is pushing coal out of the mix. Emerging markets have embraced natural gas as a power generation fuel but rarely as a strategic component of a clean energy mix. China has increased her purchases of LNG over time. The purpose of Chinese LNG purchases has been to improve air quality in northern China, an effort that has been stunningly successful and is expected to continue for some time. China’s LNG binge has contributed directly to increased confidence among LNG project sponsors, and that confidence translates, in part, to positive investment decisions for new capacity.


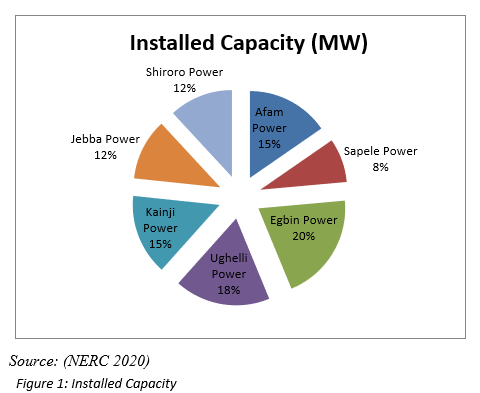
According to USAID (2020), Nigeria is the largest economy in sub-Saharan Africa. It is also endowed with large oil and gas deposits, and huge potentials for hydro and solar energy. As demand for local consumption of gas intensifies, especially for gas-to-power, Nigeria may take advantage of the low prices to increase power generation. Uninterrupted power supply through the use of LNG will bring about a functional industrial hub. According to the Nigeria Electricity Regulation Commission (2020) the six power generation plants of Afam, Sapele, Egbin, Ughelli, Kainji, Jebba and Shiroro generated a total of 5048 Megawatt (figure 1).
 

Compared to hydro and other dirty resources, LNG is a more cost-effective approach to generating electricity, even when power is used flexibly, there would be space for use in other domestic activities such as cooking, lighting and heating. Holding the LNG option open as an alternative to the dirty energy would provide scope for innovation in order to increase the nation's ability to generate more electricity to light more homes and power factories. In addition to advances in vehicle performance, LNG could form a bigger part of the transport energy mix as a lower-carbon fuel. In contrast to diesel, kerosene and fuel oil, the use of LNG is being exploited as a transport fuel for trucks and vessels with possible economic and environmental benefits. In contrast to diesel, kerosene and fuel oil, the use of LNG is being exploited as a transport fuel for trucks and vessels with possible economic and environmental benefits. The environmental performance in terms of CO2 emissions and the availability of abundant natural gas reserves make it a potentially viable alternative fuel while it has lower energy content than diesel in terms of volume.


LNG can reduce problems of poor air quality when used in power generation, as an industrial fuel and as a transportation fuel. While Compressed Natural Gas (CNG) is used in passenger and return-to-base commercial vehicles, Liquefied Natural Gas (LNG) also presents a cleaner alternative to the use of oil products for heavy-vehicle road and marine (inland) transport. LNG has contributed to reducing carbon emissions and provided reliable support when combined with renewable energy. This combination can be delivered as integrated solutions for centralized energy systems as well as for decentralized systems, for example, for the residential market, where solar applications are becoming increasingly available. On these grounds, natural gas can act as a companion fuel to renewable and play a key role in the transition to a low-carbon energy system.


Conclusion

As gas-fired generation emits half the CO2 of coal-fired generation, the contribution that gas could make towards a low-carbon environment is thus substantial. Natural gas has proven its carbon advantage relative to coal, and as developed countries have shown, natural gas can have an immediate impact in reducing local pollution; these benefits should be incorporated in policy frameworks. To meet the growing demand for power generation, transmission and distribution, as well as means of transportation as the world, tries to tackle emissions, power plants and vehicles with the use of cleaner liquefied natural gas energy would be required. LNG has the potential to give fuel cost savings compared to traditional diesel and premium engine.
AfCFTA Tariff Barrier Removal in Energy Market and the Growth of African Economy

Submitted by kiakiagas on

Introduction

Prior to the modern-day national economies, African cities and empires have been dynamic, driven by vast trading channels between cities and kingdoms. Some of the trading routes were overland, others included river navigation, while some were established across coastal cities. Powerful African empires were prosperous economically because of their trading networks, such as Ancient Egypt, Nubia, Mali, Ashanti, and the Oyo Empire. These empires increased the quantity of goods and services through vibrant trade as their empires were expanding and population was growing with minimum or no tariff barrier. In the modern days, various countries in Africa that are endowed with essential natural resources such as crude oil to produce non-renewable energy see opportunity in increasing their capacity to produce more goods and services. The excess of what is produced are traded to other regional countries in exchange for revenue.

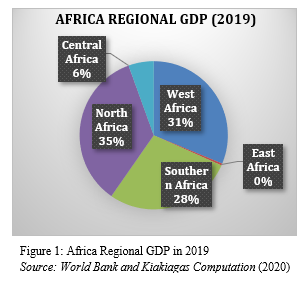
The United Nations predicted Africa's economic growth was 3.5% in 2018 amounting to $2.5 trillion and 3.7% in 2019amounting to $2.6 trillion. During the year, the Africa GDP amounted to US$2.6 trillion with the sub Saharan Africa GDP which was US$629.8 billion, East Africa US$8.7 billion, Southern Africa US$564.8 billion, North Africa US$701.6 billion and Central Africa US$111.2 billion. The largest percentage was recorded in the North Africa 35% followed by the West Africa 31%, Southern Africa 28%, Central Africa 8% while the Eastern part of the continent recorded the least percentage (see figure 1).

These values are expected to improve as the AfCFTA envisage removal of tariff barrier. The oil producing countries will increase the volume of trade to non-oil producing countries within the continent. This will bring about cheaper energy generated from the oil because of the tariff relief. Consequently, cost of producing other goods and services in the continent will reduce. According to the law of demand, consumers will be willing to buy more if the price is cheaper. Inventories will be cleared and production will flow. Innovations to produce goods and services at cheaper rate will set-in as a result of competition. This will also trigger the need for clean energy to power industrial machine to produce and increase the volume of production in the continent.

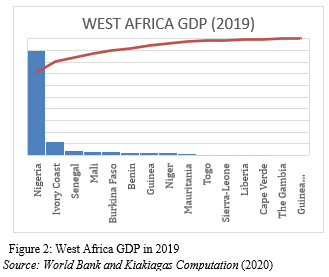
Data suggest parts of the continent are now experiencing fast growth. This is not unconnected to the energy resources available and political stability that ensured and sustained economic policy since 2007. Nigeria has the highest percentage of GDP in West Africa (71%) while Cape Verde and some other countries have the lowest percentage level of GDP (See figure 2).

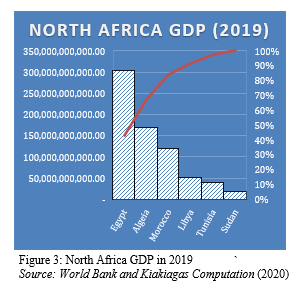
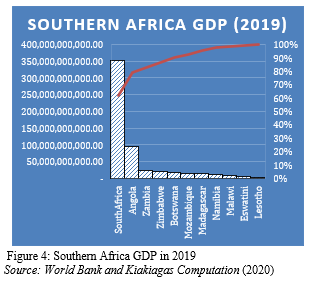
A World Bank (2018) reports the economy of Sub-Saharan African countries grew at rates that match or surpass global rates. The report says economic activity has rebounded across Africa. However, the pace of recovery was uneven among groups of countries and subregions. Oil-exporting countries generally expanded more strongly than oil-importing countries. According to the United Nations Department of Economic and Social Affairs, the improvement in the Africa aggregate growth is largely attributable to a recovery in Egypt, Nigeria and South Africa, three of Africa's largest economies (see figure 2, 3 & 4).

Africa has significant resources for generating energy in several forms (hydroelectric, reserves of petroleum and gas, coal production, uranium production, renewable energy such as solar, wind and geothermal). The lack of development and infrastructure means that little of this potential is actually in use today.

The largest consumers of electric power in Africa are South Africa, Libya, Namibia, Egypt, Tunisia, and Zimbabwe, with each consuming between 1000 and 5000 KWh/m2 per person, in contrast toeast African states such as Ethiopia, Eritrea, and Tanzania, where electricity consumption per person is negligible. Petroleum and petroleum products accounted for a 46.6% share of Africa's total exports in 2010; the second largest export of Africa as a whole is natural gas, in its gaseous state and as liquified natural gas, accounting for a 6.3% share of Africa's exports.


Energy Trade Integration and AfCFTA

Energy trade integration in Africa especially crude oil, has long been seen by African policymakers as a mechanism for fostering industrial prosperity. Energy both renewable and non-renewable are used to power light and heavy machines in the industrial sectors for productivity. Several trade and regional economic integration groups have been formed over the years. These include Southern African Customs Union (SACU), East African Community (EAC) and the Economic community of West African States (ECOWAS) to ensure flow of goods and services with little or no tariff among the countries.

These organizations aim to ease the trade barrier among themselves but this has not yielded the expected result in the respective regions, because no African region can act in isolation. There is the need for continental trade integration that will ensure tariff barrier removal to promote economic growth in Africa. The AfCFTA is the most ambitious initiative in this vein. It can support the realization of the continent’s economic promise by helping raise productivity and investment, and thereby increase income levels and reduce poverty. Assessment of income and welfare gains from trade liberalization under the AfCFTA and potential transitional costs for countries participating in the agreement is noted. The discussion focuses on the potential effects of the AfCFTA on income, welfare, trade flows, employment and tax revenues.


Economic Growth and Removal of Tariff Barrier in AfCFTA Agreement

It was earlier stated that no African region can trade in isolation to increase the continental productivity. Economic growth is ensured if there is increase in the capacity of African countries to produce more goods and services. This can only be realized when the non-renewable energy such as crude oil and natural gas  to power industrial machines are readily available with no tariff barrier. The AfCFTA has the potential to increase income and welfare significantly for its member countries.

Previous studies have estimated that African countries could reap long-term income gains of up to 5 percent from the removal in trade barriers in the context of the AfCFTA. The implementation of the AfCFTA could result in transitional costs for member countries. These may include tax revenue losses from no import tariffs, higher income inequality and higher unemployment. These could occur especially where trade liberalization is not accompanied by reforms to make labor markets more flexible and workers more mobile to grasp new opportunities.

Given the gradual nature of tariff barrier removal envisaged by the agreement, countries should have time to mitigate these potential costs. For the continent as a whole, tax revenue losses from the elimination of import tariff are estimated to be modest. Because any tariff revenue losses are likely to be offset eventually by higher tax revenue from increased consumption and income, as a result of removing tariff barrier. Limiting negative employment effects will require increasing formal labor market flexibility. Addressing adverse income distribution effects calls for broader and more efficient social safety nets.

Training and retraining programs to adapt worker skills to new needs may also be necessary. Improving revenue mobilization will be important. Given that income gains may take time to materialize, the corresponding revenue increases may not compensate for tariff revenue losses in the short term. In addition, higher revenues will also be needed to help finance infrastructure improvements and upgrade social safety nets to mitigate transitional costs from removing tariff barriers.

Furthermore, an enabling business environment, access to credit, and adequate human capital are critical to support energy trade. A more fully developed regional financial infrastructure can also help facilitate further intraregional trade.


Conclusion

Maximizing potential welfare and income gains from the AfCFTA would require member countries to substantially and strategically reduce tariff barrier. It is important first to remove the tariff barrier that impose the highest trade costs. In this regard, customs and administrative entry procedures, technical barriers to crude oil trade and other forms of energy tradeable should be tackled up-front. It would also be important to improve the quality of trade logistics and close Africa’s infrastructure gap, particularly in the areas of ports and road networks. Conclusively, upholding the provisions of the AfCFTA agreement will be crucial to ensure economic growth of the continent. An institutionally strong and effective AfCFTA secretariat, with the capacity to implement trade rules in line with the text of the agreement, will help build credibility and reduce trade-in-energy policy uncertainty.


PROSPECT AND IMPACT OF AFRICAN CONTINENTAL FREE TRADE AREA(AfCFTA) ON THE ENERGY MARKET

Submitted by kiakiagas on

PROSPECT AND IMPACT OF AFRICAN CONTINENTAL FREE TRADE AREA ON THE ENERGY MARKET

Introduction

The African Continental Free Trade Agreement (AfCFTA) entered into force on 30th May 2019 to facilitate industrialization, economic growth and prosperity in Africa. The AfCFTA aims to put together all 55 African Union Member States, representing a population of more than 1.2 billion people, with a rising middle class, and a total gross domestic product (GDP) of more than US$ 3.4 trillion. Estimates from the United Nations Economic Commission for Africa (UNECA, 2020) asserted that the AfCFTA can raise intra-African trade by 52.3 per cent by reducing import tariffs and to double the trade if non-tariff barriers are also eliminated. Originally, the main objectives of the AfCFTA are:


(i)   to create a single continental market for goods and services, with free movement of business persons and investments, and thus pave the way for accelerating the establishment of the Customs Union;

(ii) to expand intra-African trade through better harmonization and coordination of trade liberalization;

(iii) to enhance competitiveness at the industry and enterprise level through exploitation of opportunities for scale production, continental market access and better reallocation of resources;

(iv) to aid the movement of capital and people in the continent and;

(v) to enhance the competitiveness of member states within Africa and in the global market.


The continent boasts of countries that are endowed with energy resources which include renewable and non-renewable energy resources to boost industrial outputs. According to Tulane University (2015), energy resource is something that can produce heat, power life, move objects, or produce electricity. Renewable energy comes from natural sources or processes that are constantly replenished. For example, sunlight or wind keep shining and blowing, even if their availability depends on time and weather while non-renewable energy sources include fossil fuels such as oil, gas, and coal which take a longer time to replenish. Countries that are endowed with non-renewable energy sources include Algeria, Angola, Egypt, Libya and Nigeria. Nigeria is Africa largest oil producer and with the second-largest proven oil reserves in Africa, produced more than 2.5 million barrels per day between 2015 and 2019. There are other countries on the other hand that are blessed with other natural resources and cannot boast of having energy in the form of fossil fuel that are necessary for industrial operation. It is against this background that African leaders deemed it fit to come together to sign an agreement that will ensure free trade of energy, goods and services without any form of restriction from the abundant countries to the needy countries. Hence the formation of African Continental Free Trade Agreement (AfCFTA).


This article will examine the effect of AfCFTA on the energy market in Africa and to create public enlightenment on the potential benefits and threats to the Africa energy market. According to the international energy agency (IEA Outlook, 2019), Africa’s population is among the fastest-growing and youngest in the world. One-in-two people added to the world population between today and 2040 are set to be African, and the continent would become the world’s most populous region by 2023, overtaking China and India. Growing urban populations mean rapid growth in energy demand for industrial production, cooling and mobility. With the growing appetite for modern and efficient energy sources, Africa also emerges as a major force in global oil and gas markets.


Potential Benefits of AfCFTA to the Energy Market in Africa

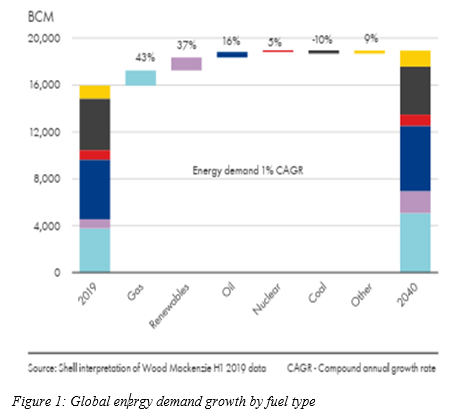
There is an increase in global demand of fuel as forecasted by the Shell LNG Outlook (2020) between renewable and non-renewable energy as renewable energy and gas are expected to replace coal in the global energy mix by 2040. Records show that demand for gas is growing by 43%, renewable energy by 37%, oil and nuclear by 16% and 5% respectively while coal declines by 10% and other nonrenewable energy are growing by 9% (see figure 1).

There are potential benefits for the African countries to also participate in the use of cleaner energy to limit the harmful emission from dirty energy. Countries like Algeria, Angola, Egypt, Libya and Nigeria who are endowed with crude oil for gas production can increase their trade volume and revenue as the world is switching to cleaner energy for commercial and domestic use. With the introduction and implementation of AfCFTA that seek to ensure free trade in the continent, these countries will be able to trade without being subject to high tariff payments. Also, against this context, AfCFTA is planned to be a continental instrument that would facilitate economic integration by establishing a single energy market, ensuring the removal of tariff barriers (TBs) and non-tariff barriers (NTBs) and allow for national trade and investment security policies.


Another potential advantage of AfCFTA is to enable cleaner energy producers to benefit from economies of scale, to access lower transmission costs and to improve the conditions for regional energy value chains. This would accelerate the transition of African economies towards greater technology and information use (Saygili, Petrs and Knebel, 2018).

AfCFTA is opening up Africa to African investors. The ability to transform Africa by making energy cheaper will be impressive. One main anticipated outcome of the deal, for example, is the increase of industrial production, which will depend on the quality, sustainability and safety of the energy sources on a scale for industrial growth. The AfCFTA will not only raise inter-regional trade in energy in Africa but will also increase the rate of trade in manufactured products, machinery, equipment and services around the African markets. The target market for AfCFTA is projected to be 1.27 billion people, predicted to grow to 1.7 billion by 2030, of which around 600 million people will be middle-class (Bramdeo, 2018). In terms of gross GDP, this would range from $2.1 trillion to $3.4 trillion or $6.7 trillion in Purchasing Power Parity terms. As a result, the demand for energy used in the industrial sector and in cooking gas will increase, thereby expanding the energy market size.


Potential Threats of AfCFTA to the Energy Market in Africa

Tariff barrier and non-tariff barrier are mostly considered to automatically facilitate free trade in the African energy market without giving more attention to the infrastructure that is not built for intra-Africa energy trade. The infrastructural facility plays a major role in the value-chain of energy. The transmission and transportation of energy within the continent require reliable infrastructure.  So there are still other challenges to overcome and they need time.


Since not all goods and services would be liberalized, it goes without saying that the effect of the AfCFTA on the energy market will depend on the outcome of the ongoing negotiations. For example, the liberalization of such goods might instantly break the current monopoly of the OPEC cartel. The driving force behind this result might not be the abolition of tariffs (which will still be sequential and may not have an immediate effect on trade patterns) but the removal of non-tariff barrier.


The key challenge is to provide universal access to secure, new, affordable and renewable energy. How to do this is a core component of Africa's Agenda 2063 Strategic Vision for the Future of the Continent and of the Global Sustainable Development Goals.


Conclusion

Rising urban populations mean a rapid increase in energy demand for industrial development, heating and accessibility. With an increasing demand for new and reliable energy sources, Africa is also emerging as a major force on global oil and gas markets. Studies showed that the estimated rise in oil demand in Africa is higher than that of China and second only to that of India. This is due to the size of the car fleet that is more than double, most of which have poor fuel efficiency, while liquefied petroleum gas (LPG) is increasingly used for clean cooking. Africa's rising weight is also felt in natural gas markets as the continent becomes the third-largest source of global demand for gas over the same period. However, the forum for the removal of tariff barrier and non-tariff barrier in Africa is always a sweetener, which certainly has the potential to find alternatives for the energy market in Africa. AfCFTA's crucial mission is to address the hindrances of transmission and transportation mechanism for intra-Africa energy trade, chronic poor networking and communication.


Kindly book for a free session with our team of experts to help you http://www.kiakiagas.com/book-session or write us an email at advisory@kiakiagas.com or Whatsapp: +2348085269328

NLNG TRAIN 7 PROJECT

Submitted by kiakiagas on

13th May, 2020: The Nigeria LNG Limited (NLNG) signed the  engineering, procurement and construction (EPC) contracts for the Train 7 project. 

This contract was signed with the SDC JV consortium, led by Saipem, alongside Chiyoda and Daewoo. The signing of the contract marks the commencement of the detailed design and construction phase of the project.


The train 7 project is expected to deliver 8 million tonnes of LNG per annum, raising the annual NLNG production capacity to 30 million tonnes LNG per annum. That’s a 35% increase from current capacity and will ensure Nigeria remains the 5th largest LNG exporter globally.

NLNG currently produces 22 million tonnes of LNG and 5 million tonnes of NGLs per year.

The GMD of NNPC, Mele Kyari, stated that the executed project will provide $20 billion in net revenue for Nigeria.


The  $4 billion facility in Bonny Island will contain:

  •  a liquefaction unit

  • An 84,300 cubic metres storage tank

  • A 36,000 cubic metres condensate tank

  • 3 gas turbine generators


The project, worth over $4 billion, experienced delays since the global economic meltdown. The commencement of this phase reassures investors that Nigeria is still a viable investment destination.

The NLNG is a joint-venture between the NNPC, Shell, Total and Eni.

https://youtu.be/z8epJIQPDQs   KiakiaGas Limited is a leading Gas business in Lagos,Nigeria with expertise in LPG retailing, New Gas Market development, Building of Gas Plants and Gas strategy advisory
If you need a partner with hands-on local expertise in the Nigerian Gas space or any of our bespoke solutions/services, write us at gaspreneur@kiakiagas.com or call/Whatsapp: +2348085269328 

LPG AND ITS APPLICATIONS

Submitted by kiakiagas on

The development of science and technology results in the discovery of more applications of an already existing resource (for instance, grain drying with propane). Favourable government policies enable these technologies to become main stream (such as Autogas in the Netherlands). In a previous article, The Case for Gas, some applications of natural were mentioned such as the application of gas to power generation and transportation. In this article, an overview of various application of the Liquefied Petroleum Gas (LPG) in the world and how it can be incorporated in Nigeria, and Africa at large, will be undertaken.

LPG is composed of propane and butane, which are combined in different ratios (e.g. Nigeria uses a 95% butane and 5% propane specification), and these ratios determine how the fuel will burn. LPG is normally liquefied under pressure for transportation and storage.  The World Liquefied Petroleum Gas Association (WLPGA) describes LPG as a clean-burning, sustainable and efficient fuel and a vital source of energy for hundreds of millions of people throughout the world today. Nigeria with a population of about 200 million people, consumed just 840,000 tonnes of LPG in 2019, which means the per capita consumption of LPG is currently 4kg. This is an increase from the per capita consumption of 2.3kg reported in 2016 which was less than the Sub-Saharan LPG per capita consumption of 2.5 kg.


LPG CONSUMPTION BY SECTOR IN AFRICA   

The World Bank group (2018) indicated that Africa has an average per capita consumption of LPG of 3 kg per year. Africa had a population of approximately 1.3 billion people in 2018, leading to an estimated total LPG consumption in Africa of 3.9 million tonnes in 2018.  When compared to the global LPG consumption of the same year, which was 300 million tonnes, the African market is negligible in the grand scheme of things. It stands to reason that African consumption of LPG is low because it is not diversified.

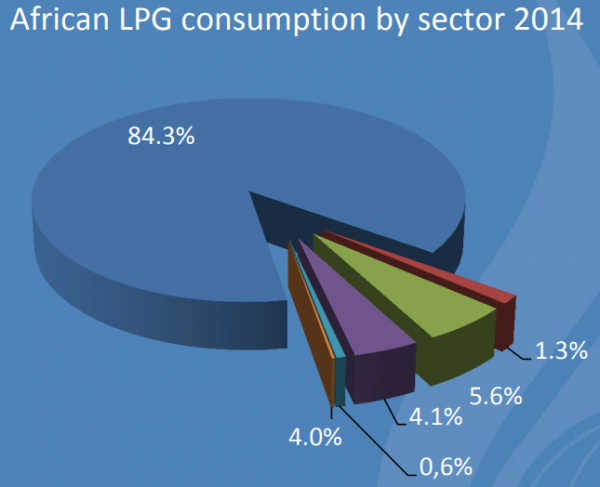
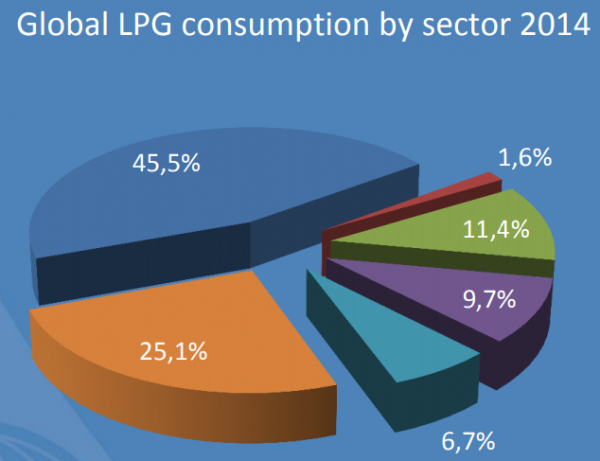
The major use of LPG in Africa is as a domestic fuel for cooking, with the domestic sector making up 85% of LPG consumption in Africa in 2014, while the domestic sector only made up 45% of global LPG consumption in 2014. Admittedly, consumption patterns have changed since 2014 but there is no data available to indicate that Africa’s application of LPG has changed considerably. Africa’s lack of diversification can be linked to its low level of industrialization. In 2016, the United Nations (UN) reported that the continent accounted for 3% of the global manufacturing output in the 1970s but that has since been halved. Also, in the agricultural sector, there is little mechanization, leading to low productivity. The industrialization of Africa will, like a ripple effect, lead to more non-domestic demand for LPG, which will result in a growth in total LPG consumption in Africa.


Source: WLPGA (2016), The role of LPG in supporting African Development.


Source: WLPGA (2016), The role of LPG in supporting African Development.


APPLICATIONS OF LPG

It is necessary to look into a few applications of LPG (apart from cooking) that will be useful in Africa, Nigeria in focus. LPG is clean and efficient fuel, offering benefits to the consumers, industry and environment. LPG can be used in transportation, in commercial business, industry, farming, domestic heating and cooking, and for recreational purposes. A few of these applications are explained below:

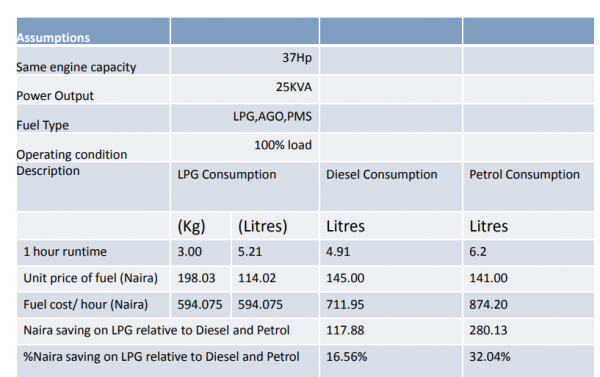
  1. Transportation: Automotive Gas (Autogas) is the term describing LPG used as a fuel for motor vehicles. A comparison between LPG, diesel and petrol was carried out by Nuhu Yakubu (Nigeria LPG Association) on a on a 25KVA generator set producing 37HP for one hour, and it was proven that LPG is more cost efficient than petrol and diesel. Every litre of Autogas used instead of petrol saves 27 naira. Nigeria consumed 21 billion litres of petrol in 2019; hence 567 billion naira would have been saved if Autogas used instead of petrol.


Figure 3. Comapirson between liquid fuels.

Source: Nuhu Yakubu, Autogas; is Nigeria Ready?


  1. Agriculture: in 2018, 70% of farming in Africa was subsistence farming without much commercialization. Most farmers use crude tools, relying on hoes and cutlasses, thereby leading to low productivity rates. In Africa, the average level of productivity in a corn farm is 1.5 tonnes per hectare, but the Cinnamon Ridge Farms, for instance, produces 22 tonnes per hectare due to proper mechanization techniques. Cinnamon Ridge Farms is a 2,000 hectare farm which grows soy, maize and other crops in the United States of America. The farm is highly mechanized, with tractors, ploughs and combined harvesters, having only 11 workers. Also, in Nigeria, 45% of food produced spoils due to inadequate storage facilities. The initial cost of purchasing equipments and installing the necessary infrastructure (e.g. tractors, or grain dryers) to assist production and storage might be too high for the farmers to bear but the cost of maintenance can be borne by the farmers, especially if they are fuelled by LPG.

Some current applications of LPG on farms include:

  • Heating with constant temperature control (LPG allows for excellent temperature control).
  • Fuel for all kinds of farm vehicles e.g. tractors, low-riding lawnmowers, etc.
  • Propane-flame weed control.
  • Propane grain dryers which uses half the thermal energy as conventional fuels to remove moisture from harvested grain.
  • Propane fuelled irrigation engines (cleaner than conventional fuels).           


  1. Industrial: LPG is a versatile fuel with widespread applications, because it has a high calorific value (i.e. it burns hotter than natural gas). This quality makes it preferable for a ‘mains’ gas. It can be used in various industries such as food to leather, to glass/ceramics, to concrete, to mining as well as aerosol, amongst many others. Brief descriptions of some industrial uses include:
  • Aerosol industry: an aerosol formulation is basically a mix of solid/liquid particles dispersed in a gas. LPG is required to act as a propellant for the particles as it is colourless and odourless. LPG does not contain any ozone depleting substances, making it environmentally safe; hence it has replaced the ozone depleting CFC (chlorofluorocarbon) gases previously used. For this, LPG can be used in sprays such as air fresheners, perfumes, etc.
  • Chemical industry: LPG can be processed into chemicals such as ethylene, propylene, butylenes, etc in order to produce synthetic plastics, fibres, etc. LPG is also a feedstock in the pharmaceutical, dye and explosive industries. LPG is used as a steam boiler in the production of rubber. LPG is also a great replacement for CFCs in refrigerators.


  1. Energy: LPG enables highly efficient, decentralized power generation. This is achieved through small self-containing generators and micro-combined heat and power. This decentralization is made possible due to LPGs easy handling. LPG complements renewable energy sources whose efficiencies vary based on seasonal conditions. Currently, engineers are devoting time into perfecting LPG hybrid appliances, where LPG is used to generate electricity in combination with photovoltaic power generators or heat pumps.


CONCLUSION

It is without doubt that LPG is an efficient and a versatile product. The above listed applications of LPG are few amongst other applications which can be put to work in Nigeria. The Federal Government of Nigeria plans to increase the national LPG consumption to 5 million tonnes by 2023, this can be made possible by also convincing existing and incoming industrial facilities managers, farmers, energy providers, amongst other sectors to use LPG  in their processes.

Much infrastructure is needed to achieve this feat, and such investments will not go unrewarded. The call for the industrialization of Africa has become louder than ever; this industrialization will come with increased demand for LPG; hence investing in LPG will yield long term profit.


KiakiaGas Limited is a leading Gas business in Lagos,Nigeria with expertise in LPG retailing, New Gas Market development, Building of Gas Plants and Gas strategy advisory
If you need a partner with hands-on local expertise in the Nigerian Gas space or any of our bespoke solutions/services, write us at gaspreneur@kiakiagas.com or call/Whatsapp: +2348085269328 

UNDERSTANDING PRESENT AND POSSIBLE FUTURE DIMENSIONS OF THE MARKET FOR NATURAL GAS AS A TRANSPORT FUEL GLOBALLY AND IN KEY REGIONAL/NATIONAL MARKETS

Submitted by kiakiagas on

Introduction

Since the invention of the internal combustion engine in the 1800’s, the word transportation has been synonymous with one thing - “Oil”. Without it, modern transportation as we know it would not be possible, sectors such as aviation, aerospace, automobiles, shipping needless to say would look nothing like they do today. However with the looming environmental/energy crisis coupled with an ever increasing population size, several voices have been clamouring for a redefinition of the transport sector by seeking for alternative fuel sources.

Why Natural Gas

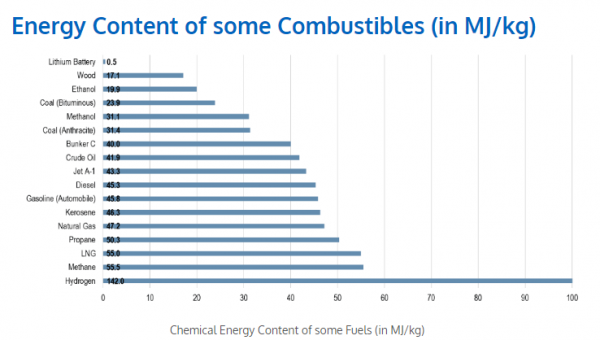
Even though natural gas is considered a fossil fuel it’s currently the cleanest fuel and most environmentally friendly fuel present today. Research shows that combustion of Liquefied Natural Gas (LNG) releases 6% to 11% CO2 less emissions than petroleum, 50% less than coal, and 20% less than diesel and while the price varies from region to region the general consensus is that natural gas is cheaper and delivers more energy per weight compared to other fossil fuels. Commercially available forms of natural gas include CNG(compressed natural gas) which is obtained by subjecting natural gas to extreme pressures of up to 3,600 psi, LNG(liquefied natural gas ) obtained by reducing the temperature to very low temperature of up to -1600c or -220 F, each with its own benefits and modes of storage. Compressed Natural Gas is the cheaper of the two fuels but occupies more space and weight than LNG..It is important to note that globally world consumption of natural gas is projected to more than doubles, from about 12 Trillion Cubic Feet in 2012 to 29 Trillion Cubic Feet in 2040 according to the US Energy Information Administration International Energy Outlook 2016 report. We now look at transportation fuelled by natural gas in different dimensions. 

Energy Content of some combustibles (in MJ/Kg)


In Private road vehicles

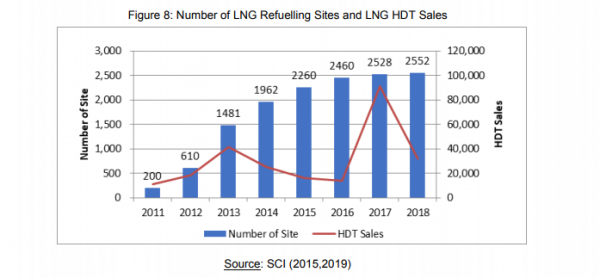
These refer to vehicles owned by individuals and are predominantly powered by Internal combustion engines (ICE’s) mostly using petrol or diesel. While recently the use of Electric and hybrid powered vehicles have recently been on the increase, the primary competitor remains petrol engines. Although Gas powered engines are also ICEs and operate the same way, the challenge lies in the cost of adapting existing vehicles to consume CNG or LNG which requires special storage. In the case of LNG the tank would have to provide the very low temperatures required and with CNG maintain and preserve pressure, the size, weight and complexity of the required tanks means additional overall costs to the consumer, bearing in mind that the primary objective for private owner is to maximise available space while minimizing cost. In addition strict safety regulations make the designing, use and even research costs further increase. Furthermore private vehicular use would require large investments in terminal and fuelling infrastructure such as LCNG (Liquefied & compressed natural gas) refuel stations which would also need underling supplychain infrastructure to be built which further increases the cost of adoption. Some countries such as In Italy due to its wide pipeline distribution has about 780,000 natural gas vehicles (According to a 2013 research paper “LNG as vehicle fuel and the problem of supply: The Italian case study”) of which less private car ownership is virtually non-existent, about 860 refuelling stations which accounts for 30% of European natural gas refuelling stations, this show that for private users adoption may not be impossible but perhaps not viable in the short term for countrieswithout the underlining infrastructure. In Heavy Road Vehicles These refer to large land vehicles such as public busses, trucks and even construction vehicles such as cranes ,Trucks, Compactors etc. which primarily run on diesel which produces more energy, mileage overall efficiency. For these category of vehicles, natural gas is a more viable option as space and weight constraints are reduced and negligible, and the reduced number of refuel stops makes natural gas a betteroption. But most importantly is the fuel saving advantage which according to the Shanghai 2019 LNG conference was $18,154 per 100000 Km for heavyduty trucks compared to diesel and $13,800 according to a 2019 Croatian study. However adoption heavily requires Government regulation and incentives, such as in china where 6.72 million metric tonnes of LNG in 2018 was consumed by the transport sector amounting to 25% of total LNG consumption. As of 2018 in China there were 343,933 LNG vehicles of which 236,265 are LNG Heavy duty trucks and the remaining107,668 where LNG buses and coaches with about 2552 LNG refuelling stations across the country, compared to Europe, where there are only4650 LNG trucks in Europe and 153 LNG refuelling stations by September 2018. This was possible due to policies such as deregulation ofthe LNG markets, massive investment in infrastructure and environmental friendly regulations such as the Three-Year Action Plan for Blue Sky issued in 2018.   In Aviation As the world becomes more and more a global village more and more attention is being paid to the fastest means of transportationAir travel. This has contributed to about 2.5% of total greenhouse gas emissions worldwide as the IATA World Air Transport Statistics (2019 WATS)confirms that 4.4 billion passengers flew in 2018 and a 10% increase in 2019 with about 61.2 million tons of cargo being moved by air.Air planes are usually fuelled by mixtures of Kerosene which are referred to as Jet fuel with major research efforts to replace this with alternate fuels such as Biofuels, Electric energy and even Natural Gas. Historically LNG has been used in the Soviet Union as far back as 1988 by theTu-155 but was discontinued after the fall of the Union, today however the challenge for commercial flights lies in the space and weight of thestorage tank as well as the low temperature requirement. Air plane fuel already occupies about 20-25% of the take-off weight and increases based on the distance to be flown, advances in technology such as super conductors and material science has convinced several parties that natural gas couldbe the next Jet fuel. For instance Boeing announced in 2012 a program to develop planes fuelled by cryogenically frozen LNG and an AIR-LNG project was sponsored by Air Bus and the German Government. In Rail transport Due to the lower costs and emissions of natural gas several countries are working to provide gas powered trains, with estimates of 20-40% reduction in fuel costs and carbon emissions in comparison with diesel engines. Proponents of LNG technology argue that gas powered locomotives eliminate harmful emissions, greatly improve air quality, while the benefits of electric trains greatly depends on the sourceoftheir generated energy which they argue is not always as green. The Florida East Coast Railway (FECR) introduced its first LNG-powered locomotive in 2015 and had converted all 24 of its locomotives to dual fuel fuelled engines by 2017. In Europe, a consortium of European companies commissioned an LNG project to develop LNG-fuelled cargo vessels and locomotives, with The European Commission providing €16.5mn of the €33mn total project costs. Similarly, the Indian Railway Corporation has also announced plans to develop its own gas- powered locomotives and even Russia has signed a contract to deploy 24 LNG fuelled trains by 2024 and plans to start operations by 2022. In Shipping Maritime transport forms the main axis of international exchange, carrying ~90% of total traded tonnage globally with an estimated trade volume of over 10 billion tons. However according to the international Maritime Organisation this industry also accounts for nearly 33% of all traderelated emissions from fossil fuel combustion, and 2%- 3% of global greenhouse emissions which is predicted to increase up to 17% with continued increase in global trade via maritime transportation if left unchecked. Sea vessels use several fuel types which include mostly diesel, LNG (predominantly preferred over CNG due to higher energy per volume densities of LNG over CNG), Hydrogen fuel, Electric powered ships and even Nuclear energy. LNG fuel engines have been in use for many years according to the International Gas Union as at 2005 there were a total of 203 LNG fuelled ships in operation by 2018 there were 525. One reason for this is that the marine industry is uniquely positioned to be easily fuelled at port with the use of LNG bunkering at seaports, where LNG is provided to the ships for its own use and consumption, Currently LNG fuel bunkering is available at seven EU sea ports and several ports in Norway, Singapore, China and other Countries. Another major driver is Government policy and regulations such as the EU Funding Support (Regulation No 1315/2013) that Specifies that LNG projects are eligible for funding from the Connection Europe Facility (CEF) Fund with 17 sources to co-fund LNG infrastructure development in the EU. Another policy is the Alternative Fuels Directive (Directive 2014/94/EU) which includes creating a network of LNG fuelling points in major ports to facilitate LNG bunkering in Coastal ports by end of 2025 and Inland ports by 2030.Japan with its extensive infrastructure for LNG is positioning the Port of Yokohama as a model for developing LNG bunkering capabilities and is also coordinating its activities with Singapore which is one of the main global bunkering hubs, and the second largest container port in the world.        Growth Outlook and Prospects for Africa So what does this all mean for Africa, well Africa was thought to house about 7% of global reserves from the top four countries namely Libya, Egypt, Nigeria and Algeria, however recent discoveries of gas deposits in Mozambique, Tanzania, Senegal and Mauritania have revealed a total of 200 Tcf of gas reserves, enough to meet close to 70% of global demand for the next two decades. According to the African Energy Outlook 2020 report, there are currently nine oil projects under construction across the region with an investment total of $60.4 billion and in light of the recent discoveries, the East African countries could see $60 billion worth of investments. However it’s important to note that as far as consumption is concerned the figures aren’t encouraging while Sub Saharan Africa supplied 12% of global LNG production in 2018(over 250 Million Tons) approximately 70% of African Consumption was accounted for by Egypt and Algeria alone. According to the International Gas Union 2019 Report, no African Country is currently investing in Natural Gas as fuel for Heavy duty vehicles. The focus lies rather on increasing production, processing and bunkering facilities such as the Seventh Train expansion project at the Nigerian LNG facility in Bonny Island to increase production from 22 million tonnes per annum (Mtpa) to 30Mtpa per annum last year December and the planned $20 billion Natural gas liquefaction and export terminal in Anadarko Mozambique, the largest single LNG project ever sanctioned in Africa. On the marine scene however bunkering stations for LNG vessels are being built for instance in South Africa, LNG bunkering services have been licensed to begin in the Algoa bay this year by an 8,000 tonne LNG bunker barge, the largest built African vessel by weight. Egypt Also seeks to start LPG bunkering at the Damietta port but was halted due to complications legal and domestic issues. The path to LNG use for transportation on the African Continent is long but not impossible. The first hurdle being, how to increase the underlining local production and processing infrastructure something all governments are striving to do with plans such as Nigerian Gas Policy of 2017 developed by the Ministry of petroleum resources or Egypt’s Sustainable Development Strategy (SDS) Vision 2030 with regulations like a policy where no more than a third of the national gas reserves can be exported at any time to ensure domestic demands are met.   Conclusion That Natural Gas is a visible alternative transport fuel across board isn’t in doubt. However it is not a viable option in every sphere. Scientific evidence shows that the bigger the vehicle the more viable it becomes. For personal vehicles it remains a Niche market and for aviation mostly a theoretical one at this point. However for Heavy road and Marine vehicles, Natural Gas has been established as a dominant option for fuel and is rapidly growing especially in the EU, Americas and Asian markets such as China and little patronage from African Countries such as South Africa and Egypt. It is interesting to note that the more natural gas is made available the faster the rate of adoption as seen in china, Simply put as more investments are made in supply the rational choice is adoption for safer, cheaper and greener transportation.     Thank you.


The Nigerian LPG Market is the next success story of the Global LPG industry, if you need a partner with a global perspective and local expertise in the Nigerian and African space, kindly book for a free session with our team of experts to help you http://www.kiakiagas.com/book-session Or write us an email at advisory@kiakiagas.com or Whatsapp: +4915210247560, +2348085269328

BETWEEN THE NIGERIAN AND SENEGALESE LPG MARKET

Submitted by kiakiagas on

Nigeria and Senegal are located in the West African region; one with numerous mineral resources but not as much economic development. Both Sub-Saharan countries are experiencing growth in their youth populations, yielding a growing labour force and increasing urbanization.


In 2018, Nigeria had an estimated population of 200 million people, with a Gross Domestic Product (GDP) of 397 billion dollars, and a GDP per capita of $2,000 (World Bank Development Indicators, 2018). Senegal, on the other hand, had a population of 16 million people, with a GDP of 24 billion dollars and GDP per capita of $1,500 (World Bank Development Indicators, 2018). Senegal does not have crude oil reserves but produces a small quantity of natural gas.


Both countries have a number of demographic and socio-economic similarities:

  • Most of the land in both countries is used for agriculture; 78% for Nigeria and 46% for Senegal.
  • growth rates.
  • Both countries are made up of citizens of diverse ethnicities.
  • Both countries have a burgeoning youth population.


As urbanization increases in both countries, so do deforestation and carbon emissions, due to felling of trees for use as cooking fuel. This results in environmental and health hazards, and does not favour economic growth. Currently, 60% of the urban population in Senegal use LPG – without subsidies; but wood and charcoal represented 60% of Senegal’s total energy consumption when Senegal’s Butanization policy was implemented. About 60% of Nigerian households also use wood and charcoal.

The use of LPG as the prevalent cooking fuel will provide a cleaner environment without affecting the health of the users, as well as provide employment for individuals in the value chain. Both countries acted on these facts by implementing policies to increase the consumption of Liquefied Petroleum Gas (LPG) in their respective countries, although Senegal implemented their policies decades before Nigeria implemented hers. Senegal’s success and the processes involved can be used examined, and adapted to obtain similar results in Nigeria. In the rest of the article we examine the Nigerian and Senegalese LPG markets along the lines of market size, supply chain structure and enabling policy.


  1. Market Size

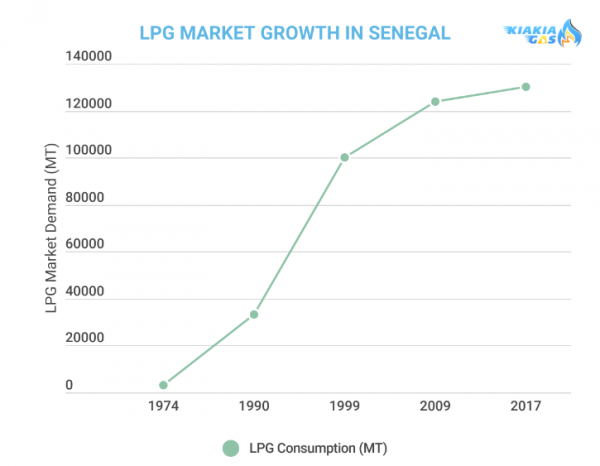
In 2018, the larger portion of the Senegalese population (particularly the urban regions) used LPG as their fuel for cooking, with 1.5 million LPG stoves in use. The Butanization program, championed by the Senegalese government in 1974, caused the market to experience growth through the years, resulting to an annual consumption of 170,000 MT in 2017. This is 56 times larger than the annual consumption at the time the Butanization programme began. The growth rate, however, began to slow down after the removal of LPG subsidy in 2009.

Senegal has been able to achieve this level of LPG usage despite their relatively limited natural gas reserves. A large portion of the LPG used in the country is imported. About 98% of the country’s LPG consumption is from the domestic and commercial sectors.


Figure 1. Growth in Senegalese LPG Consumption

     Source: (Chantelot, 2001) (Kojima, 2011) (Tyler, 2018)


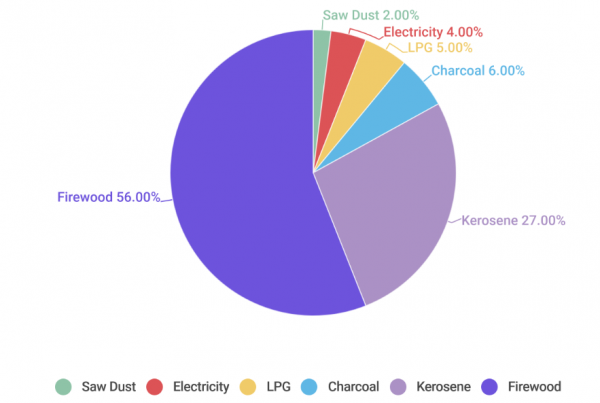
The Nigerian LPG market has also been experiencing growth. The Nigerian LPG demand grew from less than 60,000 MT per annum in 2008 to 800,000 MT per annum in 2019.  The National Gas Policy report of 2017 revealed that only 5% of the households in Nigeria use LPG - that is just 2 million households using LPG. Majority of the country (50-60%) currently depend on wood as a fuel source. There is a great potential for more growth in the Nigerian LPG market, and there are corresponding investments in all points of the Nigerian LPG value chain.

Figure 2. Nigerian Household Energy Mix

Source: National Gas Policy, 2017.


2. Supply Chain Structure

In 1963, the Societe Africaine de Raffinage (SAR) was inaugurated and given the exclusive permission to import LPG into Senegal after which it passed it on to the various private distributors. Supply of LPG in Senegal faced challenges because the country had just one (functional) container berth, limiting its storage capacity, thereby affecting total supply to the county. The country also has multinational companies (such as TOTAL and VITOGAZ), as well as independent local companies (such as Touba Gaz) distributing LPG to the wholesale outlets. The wholesale outlets supply to the retailers, who then supply to the end-users. The wholesalers specialize in the sale of LPG through gas plant facilities, while the retailers are those with shops and stores; they sell other items alongside LPG. The bulk of the LPG consumed in Senegal is imported, due to low local production capacity.

The Nigerian LPG market is fully deregulated; hence the private sector plays a major role in importing the product. Nigerian LPG production surpasses local demand by a ratio of 5 to 1, based on 2017 data, yet 60% of the LPG used in Nigeria is imported. Nigeria Liquefied Natural Gas Limited (NLNG) supplies locally produced LPG to the Nigerian market, while there are other private companies which import LPG into the country (such as Navgas and Matrix Energy). LPG, whether local or imported, is stored in any of the country’s six depots (based on the company which bought it)  from where it is sold to the gas plants. These gas plants sell to (some end-users and) the retailers who then sell to the end-users. Retailers in Nigeria are specialized in selling LPG alone, unlike their counterparts in Senegal. 60% of the LPG used in Nigeria is imported, due to low local supply capacity on the part of the main local LPG producer, NLNG (production and infrastructure).


3. Policy

In Senegal, the Comité National des Hydrocarbures (CNH) acts as a market price regulator for all petroleum products. It acts as an advisor for the Senegalese Ministry of Energy, reviewing the prices of petroleum every 4 weeks. The price of LPG in Senegal was subsidized by the government as part of the Butanization program but the program ended in 2009.


Senegalese Butanization Programme

The Butanization programme began in 1974, as a strategy by the Senegalese government to reduce deforestation, partly caused by the use of wood as a domestic fuel source (over 60% of the population at that time used wood or charcoal). The LPG demand at the commencement of the programme was just 3,000 MT.  The aim of the Butanization programme was to increase LPG consumption and decrease the reliance on biomass, particularly amongst the low-income sections of the population.

In 1974, the standard LPG package available was the 12kg cylinder with a regulator, hose and stove. The government introduced the 2.75 cylinder, with its appropriate equipments and later on, introduced an 80% subsidy on 2.75kg refills. The 6kg cylinder (with a 60% subsidy for refills) was introduced later. This created three different price structures for the 2.75kg cylinder, 6kg cylinder and the 12kg cylinder (unsubsidized). These price structures were set by Presidential decree based on the joint recommendation of the Ministry of Energy and the Ministry of Trade. The subsidies were funded from revenues obtained from taxes on other products. LPG related equipments also enjoyed tax exemptions.

The subsidy increased the consumption of LPG and in turn led to a decrease in deforestation by 15%, but was unsustainable; hence the International Monetary Fund (IMF) recommended the removal of the subsidy. The subsidy was removed in 1985, but returned two years later due to social unrest. The subsidy was finally removed in 2009, leading to a 12% increase in charcoal use. In 2017, Senegal consumed 130,000 MT per annum, showing LPG had gained a considerable market share due to the programme which had long been discontinued.


Nigeria had to incorporate necessary policies to ensure the growth of the Nigerian LPG market. These include the complete deregulation of the LPG market, removal of kerosene subsidy, as well as distribution of 3kg cylinders to low-income households. There’s no monopoly on the importation of LPG into Nigeria, as there are different companies bringing the product into the country. Due to the deregulation of the industry, prices move based on the prices at the international market. 

The deregulation policy allowed for greater private sector investment in the LPG sector e.g. the NavGas depot which came into operation in 2010. Steps are also being taken to improve local supply to local demand (8% of local supply is channelled to meeting local demand), by increasing local production. There are also investments in the production of domestic LPG equipments, such as cylinders to replace mostly expired cylinders used in Nigeria (90% of LPG cylinders used in Nigeria are expired).

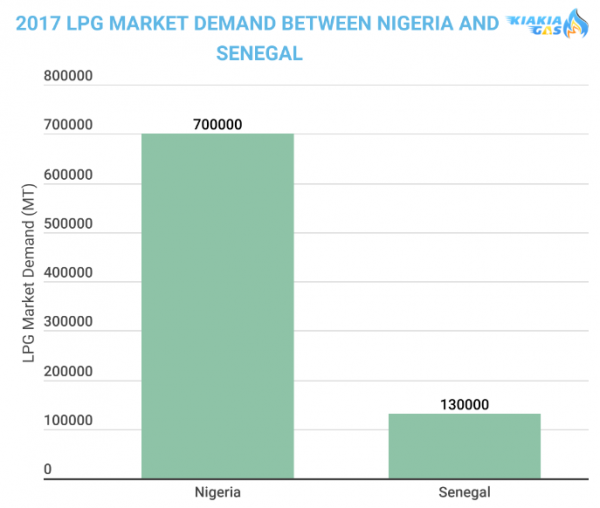
Figure 3. Comparison Between Nigerian and Senegalese LPG Consumption

Source: WLPGA, Accelerating the LPG Transition 2018.


The Nigerian and Senegalese LPG markets share some similarities, such as the dependence on imported LPG, as well as LPG competing with wood and charcoal. Senegal has been able to successfully convert the greater percentage of its households into LPG users, showing the possibility of same success rate in Nigeria. Comparing populations shows that Nigeria today has a greater market potential than Senegal did in 1974. Due to the early start, Senegal has been able to convert most of its population into LPG users in 4 decades (90% of households in Dakar use LPG), and Nigeria could do same in a shorter time if the right steps are taken.

A nationwide sibsidy system for Nigeria might not be effective, but it could make LPG cheaper to low-income households. That objective can be achieved by ensuring local (production and) supply grows to meet the growing local demand.


KiakiaGas Limited is a leading Gas business in Lagos,Nigeria with expertise in LPG retailing, New Gas Market development, Building of Gas Plants and Gas strategy advisory
If you need a partner with hands-on local expertise in the Nigerian Gas space or any of our bespoke solutions/services, write us at gaspreneur@kiakiagas.com or call/Whatsapp: +2348085269328


GLOBAL MARKET FOR GAS

Submitted by kiakiagas on

In 2018, the global gas market experienced a 4.8% growth in demand, with 70% of that growth coming from the United States and China. The growth in the global gas market can be attributed to increasing in conventional, as well as, relatively unconventional applications, such as Autogas (which experienced 40% increase in consumption in the 10 years). The gas market is connected to the oil market, but they do not necessarily follow the same trends as they have different market drivers; this is why the gas market experienced growth in demand while the oil market grew by 1%, between 2017 and 2018.


Where Does Natural Gas Come From?

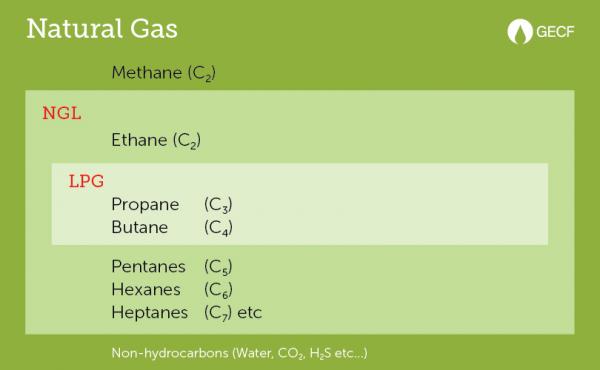
A good starting point to understand the gas market will be from its source. Hydrocarbons - crude oil and natural gas, are formed due to the pressurization of decayed organic matter over millions of years. This occurs in a naturally occurring underground reservoir. Each reservoir has a range of hydrocarbon products in it, from natural gas (methane to butane, with the presence pentane to heptane), to crude oil, as well as asphalt. The Gas to Oil Ratio (GOR) determines whether the gas is referred to as Associated Gas (i.e. gas from an oil well) or Non-Associated Gas (i.e. gas from a gas well). The GOR used by the United States Energy Information Agency is 6,000 cubic feet (cf) of gas to 1 barrel (b) of oil (6000 cf/b). Therefore a well whose GOR equal to or less than 6,000 cf/b is an oil well, gas produced from that well is referred to as Associated Gas. The major products from the separation of hydrocarbon gas are Natural Gas (methane and ethane) and Liquefied Petroleum Gas.  


Figure 1. Natural Gas and its Products

Source: (GECF, 2016)


Gas Value Chain

Natural gas can be divided based on its constituents into different products, such as Natural Gas Liquids, Liquefied Petroleum Gas (LPG), Compressed Natural Gas, etc. These products might differ due to composition or physical state (e.g. liquid or gas).

There are different sectors in the petroleum industry which include:

  1. Upstream sector: this is where the exploration and production occurs
  2. Midstream sector: this is where the refining, or processing occurs.
  3. Downstream sector: this is where the product is connected to the end-user.


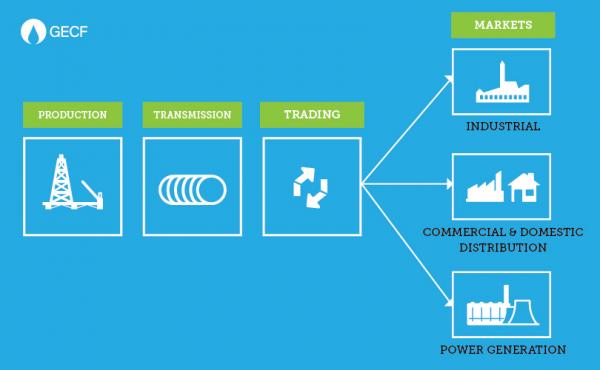
Natural gas is produced then separated into different products with different (sometimes overlapping) applications, hence their different value chains.

  1. Natural Gas (Sales Gas): this is the mixture of methane and ethane, used mostly by industries for different processes such as electricity production, or fertilizer production. It is transported via pipelines (quantity traded is known by measuring the flow rate of the gas at the exchange of ownership). Pipelines are channelled to the end-users which are industrial or commercial entities.


Figure 2. Natural Gas Value Chain


Source: (GECF, 2016)


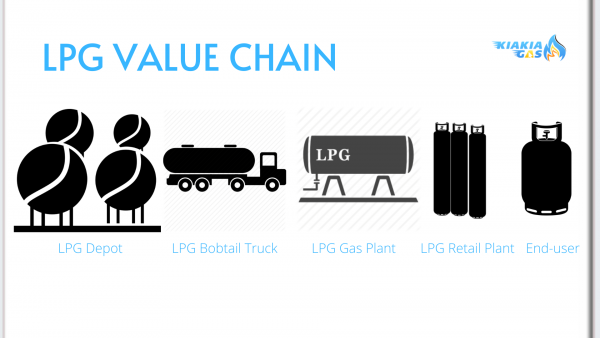
  1. Liquefied Petroleum Gas: this composes of pentane and butane, used mostly for cooking, and is finding increasing application in the automobile industry as Autogas. LPG is transported via pipelines, ships and trucks, based on the sector (upstream, midstream or downstream). When imported, LPG comes through a depot which is then transported to various gas plants from which it is connected (sometimes through retailers) to the end-users in cylinders.

Figure 3. LPG Value Chain

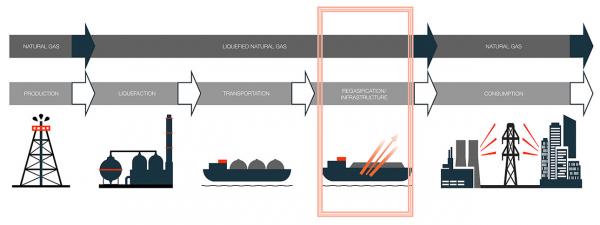
  1. Liquefied Natural Gas: natural gas is liquefied, after which it is stored then transported via land or ship (depending on the destination) to the end-users for power generation, transportation, etc. It is re-gasified before use.

Figure 4. LNG Value Chain


Source: (Hoegh LNG, 2020)


MAJOR PLAYERS IN THE GAS INDUSTRY

Oil and gas, as natural minerals, occur in different regions all over the world and are consumed in nations all over the world as well. The total recoverable (i.e. economically viable recovery) amount of oil and gas is referred to as oil and gas reserves, and they vary per country, with some countries having trillions of cubic meters of natural gas in their reserves and some countries having none. Two other factors measured are the annual production and annual consumption, which vary per country and also change with time due to economic reasons, or technology available, amongst other reasons. For instance, US crude oil production tripled between 2010 and 2020 due to the introduction of the hydraulic fracturing technology which made shale oil recoverable. Lastly, these activities are carried out by private companies and state-owned companies, sometimes in joint-ventures with each other. Certain companies have more presence globally than others (e.g. Shell operates in 70 companies globally) (Shell, 2020).


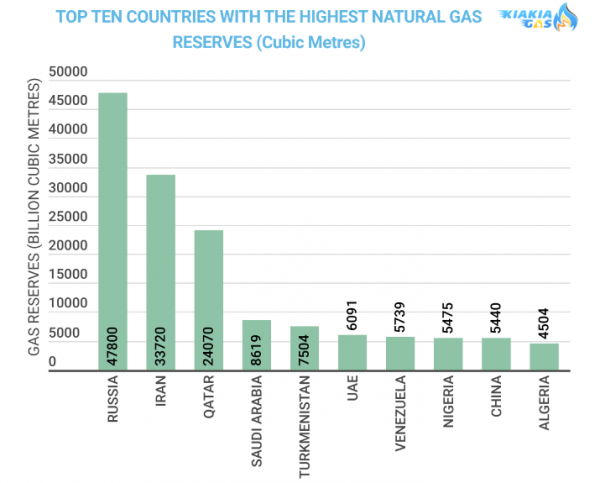
  1. Natural Gas Reserves: Reserves refer to the total quantity of oil and gas that can be recovered under current economic, technological and political conditions, in a country. Russia has the world’s largest gas reserves, boasting of 47.8 trillion m3 of natural gas. Russia is followed by Iran and Qatar in size of gas reserves, with 33.7 trillion m3 and 24 trillion m3 respectively. What countries do with their reserves depends on their governments. These top ten nations have a combined gas reserve size of 148 trillion m3 of natural gas.


Figure 5. Top Ten Countries with the Highest Natural Gas Reserves

Source: (Central Intelligence Agency, 2020)


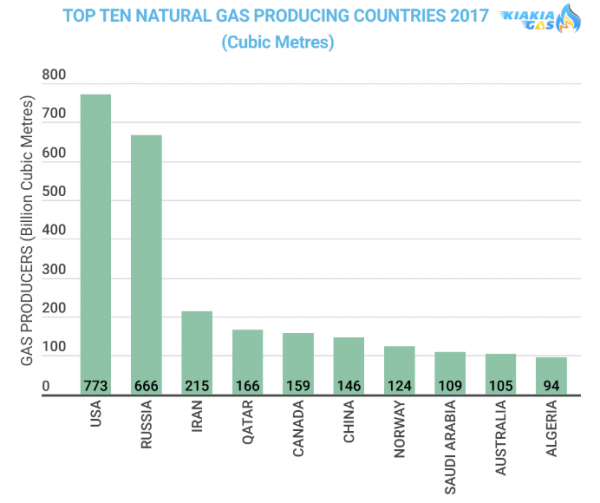
  1. Natural Gas Production: Natural gas production is based on how much Natural Gas is mined out oil and gas wells annually. Investments are needed to produce gas and can be hindered by political instability. This is why certain countries with large natural gas reserves but do not produce as much natural gas as those with smaller natural gas reserves. The USA produces the most amount of natural gas annually, producing 773 billion m3. The USA is followed by Russia and Iran, which produce 666 billion m3and 215 billion m3 respectively. It should be noted that the three countries with the highest also produce the most natural gas, although the USA produces the most. Total natural gas produced by the top ten producing countries was 2.55 trillion m3.


Figure 6. Top Ten Natural Gas Producing Countries 2017

Source: (Central Intelligence Agency, 2020)                 


  1. Natural Gas Consumption: this refers to the amount of natural gas used in a country. After processing, it’s by-products are used for separate applications e.g. LPG is mainly used for cooking, sales gas is used for electricity, e.t.c. The consumption of natural gas depends on the demand for those applications that require natural gas products in those countries.

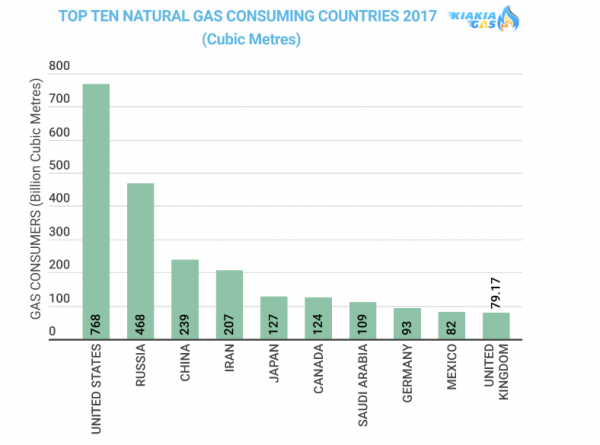
The USA is the top consumer of Natural Gas, consuming 768 billion m3 of the 773 billion m3 it producers; thereby producing more than it consumes. Russia and China are also top consumers, consuming 468 billion m3 and 239 billion m3 respectively. Russia consumes 200 billion m3 less than it produces, while China consumes 93 billion m3 more than it produces. Total natural gas consumed by the top ten consuming countries was 2.29 trillion m3.

Figure 7. Top Ten Natural Gas Consuming Countries 2017

Source: (Central Intelligence Agency, 2020)


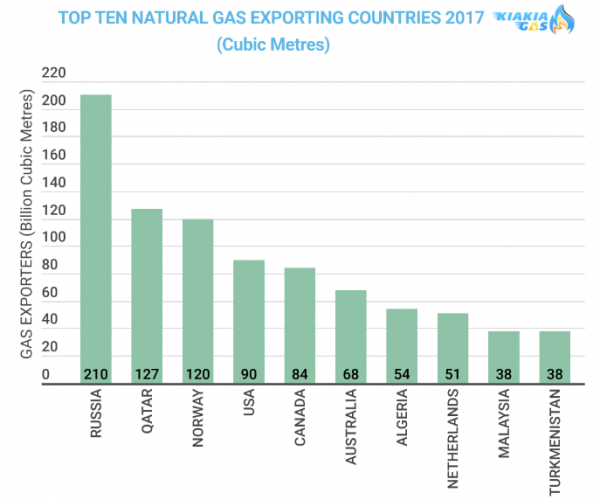
  1. Natural Gas Exports: exports refer to the amount of natural gas sold out of the country. Countries which export more than they import are referred to as net exporters. The various products can be exported through pipelines, ships, trucks. Russia exports the most natural gas, with Qatar and Norway following; they export 210 billion m3, 127 billion m3, and 120 billion m3 respectively.  The top ten exporters export a total of 880 billion m3. Analysing the top ten producers and exporters, only 34% of the natural gas produced is exported.

Figure 8. Top Ten Natural Gas Exporting Countries 2017

Source: (Central Intelligence Agency, 2020)


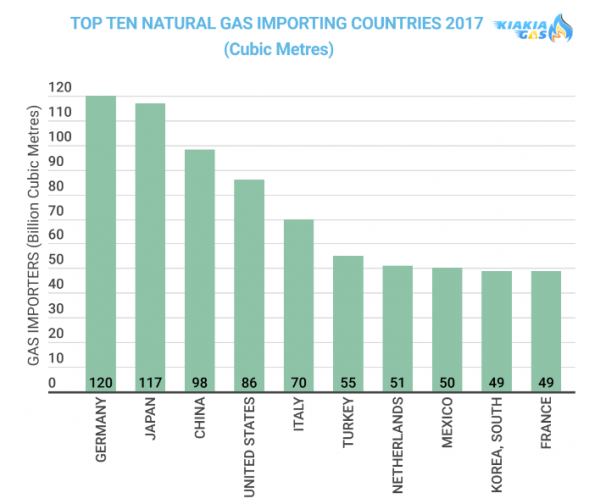
  1. Natural Gas Imports: this refers to the amount of gas brought into a country from another. A country which imports more than it exports is referred to as a net-importer. Germany imports the most natural gas, with Japan and China following; each has 120 billion m3, 117 m3, and 98 m3 respectively. The total amount of natural gas imported by the top ten importing countries is 743 billion m3.

Figure 9. Top Ten Natural Gas Importing Countries 2017

Source: (Central Intelligence Agency, 2020)


The Nigerian Context

Nigeria has the 8th largest natural gas reserves in the world and has the 18th highest production rate. Nigerian natural gas products are mainly exported because local consumption is less than half of total production. This is caused by mainly economic factors. The Nigerian gas market holds the potential for profitable investment as it has been gradually expanding, with local consumption increasing from  573 million scf/d in 2004 to about 839.70 million scf/d in 2016 (NNPC, 2020).


Table 1. Nigeria’s Gas Parameters 2017

Source: Compiled from Central Intelligence Agency Reports.


As the world sees development in technology and economies, gas production and consumption will increase. Natural gas is also a (relatively) clean fuel source, helping with public perception.  The gas market shows potential to expand and accommodate more investors and customers, the future of the gas market is bright.


KiakiaGas Limited is a leading Gas business in Lagos,Nigeria with expertise in LPG retailing, New Gas Market development, Building of Gas Plants and Gas strategy advisory
If you need a partner with hands-on local expertise in the Nigerian Gas space or any of our bespoke solutions/services, write us at gaspreneur@kiakiagas.com or call/Whatsapp: +2348085269328


Bibliography

Auto-Gas.Net, 2017. Why AutoGas. [Online]
Available at: https://auto-gas.net/why-autogas/autogas-is-growing/
[Accessed 23 April 2020].

Central Intelligence Agency, 2020. COUNTRY COMPARISON :: NATURAL GAS - CONSUMPTION. [Online]
Available at: https://www.cia.gov/library/publications/resources/the-world-factbook/fields/270rank.html
[Accessed 23 April 2020].

Central Intelligence Agency, 2020. COUNTRY COMPARISON :: NATURAL GAS - EXPORTS. [Online]
Available at: https://www.cia.gov/library/publications/resources/the-world-factbook/fields/271rank.html
[Accessed 23 April 2020].

Central Intelligence Agency, 2020. COUNTRY COMPARISON :: NATURAL GAS - IMPORTS. [Online]
Available at: cia.gov/library/publications/resources/the-world-factbook/fields/272rank.html
[Accessed 23 April 2020].

Central Intelligence Agency, 2020. COUNTRY COMPARISON :: NATURAL GAS - PRODUCTION. [Online]
Available at: https://www.cia.gov/library/publications/resources/the-world-factbook/fields/269rank.html
[Accessed 23 April 2020].

Central Intelligence Agency, 2020. COUNTRY COMPARISON :: NATURAL GAS - PROVED RESERVES. [Online]
Available at: https://www.cia.gov/library/publications/resources/the-world-factbook/fields/273rank.html
[Accessed 23 April 2020].

Emily Geary, J. P., 2019. Associated gas contributes to growth in U.S. natural gas production. [Online]
Available at: https://www.eia.gov/todayinenergy/detail.php?id=41873
[Accessed 23 April 2020].

GECF, 2016. Gas Value Chain. [Online]
Available at: https://www.gecf.org/gas-data/gas-value-chain.aspx
[Accessed 23 April 2020].

Hoegh LNG, 2020. Our Business. [Online]
Available at: https://www.hoeghlng.com/our-business/default.aspx
[Accessed 24 April 2020].

Maverick, J. B., 2020. How has fracking decreased U.S. dependence on foreign oil?. [Online]
Available at: https://www.investopedia.com/ask/answers/012915/how-has-fracking-helped-us-decrease-dependence-foreign-oil.asp
[Accessed 23 April 2020].

NNPC, 2020. ​​Nigeria Gas. [Online]
Available at: https://www.nnpcgroup.com/Investor-Relations/Pages/Nigeria-Gas.aspx
[Accessed 24 April 2020].

Shell, 2020. About Us. [Online]
Available at: https://www.shell.us/about-us.html
[Accessed 23 April 2020].


KiakiaGas Daily LPG (Cooking Gas) Price Index

Submitted by kiakiagas on

KiakiaGas offers daily and historical data across the Nigerian and African LPG (Cooking Gas) market.

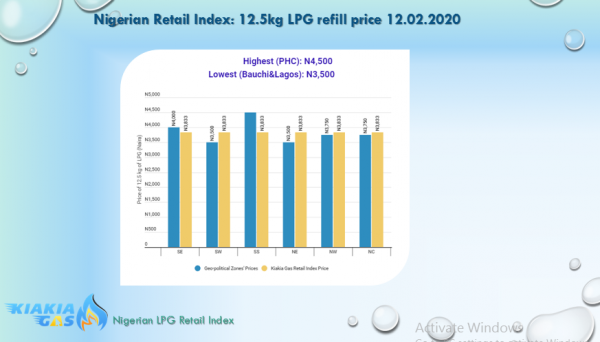
You can also contact us at data@kiakiagas.com or write on whatsapp/call +2348085269328 for more information or additional options about historical market data.

KiakiaGas Daily LPG (Cooking Gas) Depot Price Index

Submitted by kiakiagas on

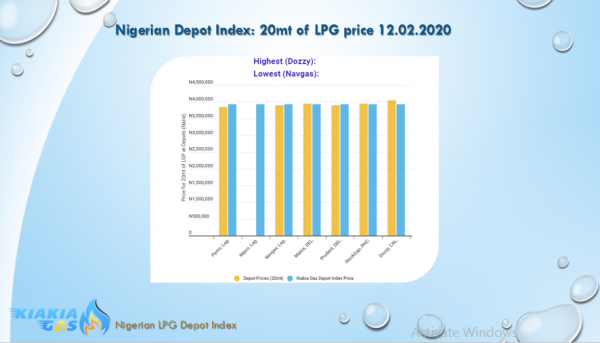
This data offers insights into price of LPG (cooking gas) at the Bulk storage level benchamarked to the kiakiagas depot index

You can also contact us at data@kiakiagas.com or write on whatsapp/call +2348085269328 for more information or additional options about historical market data.

Subscribe to Energy